Diagnostic Accuracy and Generalizability of a Deep Learning-Based Fully Automated Algorithm for Coronary Artery Stenosis Detection on CCTA: A Multi-Centre Registry Study
 Lixue Xu
 Yi He1†
  Zhenchang Wang
 Zhenghan Yang
- 1Affiliated Beijing Friendship Hospital, Capital Medical University, Beijing, China
- 2Shukun (Beijing) Technology Co., Ltd., Beijing, China
- 3Department of Computer Software Engineering, Soonchunhyang University, Asan-si, South Korea
- 4Faculty of Information Technology, Beijing University of Technology, Beijing, China
Aims: In this retrospective, multi-center study, we aimed to estimate the diagnostic accuracy and generalizability of an established deep learning (DL)-based fully automated algorithm in detecting coronary stenosis on coronary computed tomography angiography (CCTA).
Methods and results: A total of 527 patients (33.0% female, mean age: 62.2 ± 10.2 years) with suspected coronary artery disease (CAD) who underwent CCTA and invasive coronary angiography (ICA) were enrolled from 27 hospitals from January 2016 to August 2019. Using ICA as a standard reference, the diagnostic accuracy of the DL algorithm in the detection of ≥50% stenosis was compared to that of expert readers. In the vessel-based evaluation, the DL algorithm had a higher sensitivity (65.7%) and negative predictive value (NPV) (78.8%) and a significantly higher area under the curve (AUC) (0.83, p < 0.001). In the patient-based evaluation, the DL algorithm achieved a higher sensitivity (90.0%), NPV (52.2%) and AUC (0.81). Generalizability analysis of the DL algorithm was conducted by comparing its diagnostic performance in subgroups stratified by sex, age, geographic area and CT scanner type. The AUCs of the DL algorithm in the aforementioned subgroups ranged from 0.79 to 0.86 and from 0.75 to 0.93 in the vessel-based and patient-based evaluations, both without significant group differences (p > 0.05). The DL algorithm significantly reduced post-processing time (160 [IQR:139–192] seconds), in comparison to manual work (p < 0.001).
Conclusions: The DL algorithm performed no inferior to expert readers in CAD diagnosis on CCTA and had good generalizability and time efficiency.
Introduction
Coronary computed tomography angiography (CCTA) is a non-invasive tool with a high diagnostic accuracy and negative predictive value (NPV) in the estimation of coronary narrowing (1). Nevertheless, the CCTA examination workflow is time consuming and labor intensive, with an average post-processing and reporting time ≥30 min (2). With a growing number of coronary artery disease (CAD) patients (3, 4), the supply-demand imbalance of CCTA has become a growing problem. Therefore, the acceleration of the current CCTA workflow is imperative.
Deep learning (DL) has been used to assist in the imaging interpretation of CAD (5, 6), incorporating the risk stratification of patients (7–9) and the segmentation and quantification of cardiac and coronary structures (10–12). The generalizability of DL-based models is of increased importance because overfitted models could hardly be applied in real-world clinical practice. Recently, we developed a DL-based fully automated algorithm to streamline CCTA reconstruction and interpretation workflows and found that the DL algorithm significantly improved the time efficiency and diagnostic consistency of CCTA (13, 14). In addition, by using invasive coronary angiography (ICA) as a standard reference, the accuracy of the DL algorithm was not inferior to that of expert readers. However, the CCTA data were acquired from a single center with only one or two types of computed tomography (CT) scanners, and the diagnostic performance and reproducibility of the DL algorithm still need to be evaluated.
Accordingly, we used a completely external multi-center dataset to estimate the diagnostic accuracy and generalizability of the DL algorithm in comparison to ICA. The CCTA data were obtained from 27 sites (across 5 geographic areas), 4 types of vendors and 5 brands of CT scanners. There are two aims of our study: (a) to compare the diagnostic accuracy of the DL algorithm with that of expert readers in a larger sample; and (b) to determine whether the DL algorithm performs robustly for data obtained from patients with different ages, sexes, and geographic information and for data acquired from different types of CT scanners.
Methods
Study Design and Datasets
Patients with suspected CAD from 27 hospitals and 5 geographic areas (Northeast, Northwest, South, North and East China) (Supplementary Table 1) were retrospectively enrolled between January 2017 and August 2019. The study was registered at the Chinese Clinical Trial Registry (ChiCTR1900021867), and the protocol was approved by the local institutional review boards of each of the 27 enrolling hospitals in China, and the informed consent was waived. Each participating hospital incorporated CCTA and ICA into daily clinical practice. The inclusion criteria were the accomplishment of CCTA followed by ICA within 6 months. The exclusion criteria were as follows: missing CCTA or ICA data, history of coronary artery bypass grafting or stenting, coronary anomalies, poor image quality of ICA data or young age (< 18 years).
In accordance with the Society of Cardiovascular Computed Tomography (SCCT) guidelines or each site's institutional policy (15), all image acquisition and image post-processing for CCTA and ICA data were performed with no restrictions on the CT scanner type or the type of iodinated X-ray contrast. All the CCTA data were acquired on CT scanners of 64-detector rows or greater of 5 scanner brands: GE Medical Systems (Discovery CT750, Revolution CT), Philips Medical Systems (iCT), Siemens Healthineers (SOMATOM Force, SOMATOM Definition Flash, SOMATOM Definition AS+, Biograph), Toshiba (Aquilion ONE) and Shanghai United Imaging Healthcare (UIH uCT760) (Supplementary Figure 1). The CT scanner type differed by center. The type of electrocardiographic gating method was defined as either retrospective helical gating or prospective axial triggering. The tube potential (kV) ranged from 70 to 140 kV (Table 1 and Supplementary Table 2). Datasets were reconstructed retrospectively with iterative reconstruction and electrocardiography editing when necessary. The phase with optimal image quality was used for further CCTA analysis.
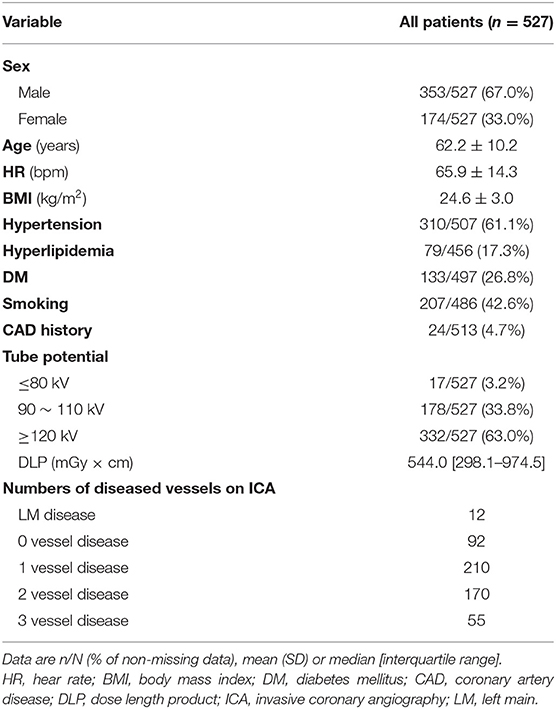
Table 1. Baseline information.
Manual Post-processing and Visual Assessment of Coronary Stenosis
Reformats images including maximum intensity projection (MIP), multi-planar reformation (MPR), curved planar reformation (CPR) and volume rendering (VR) were obtained on a on an image analysis workstation (GE Advantage Workstation 4.7, GE Healthcare, Milwaukee, Wisconsin). The interpretation of the CCTA was performed by 10 board-certified radiologists, with experience in judging more than 5,000 CCTA scans. The 10 readers were blinded to the clinical history of the enrolled patients, and they were not involved in the patients' clinical assessment. The 10 readers were divided evenly into 5 groups, and all the anonymous scans were distributed randomly among the 5 groups. For any group, each of the 2 readers independently evaluated the anonymized and randomly ordered scans and was blinded to the ICA results of the enrolled patients. The image quality of each segment was estimated by a Likert 5-scale score: a score of 5 indicated excellent quality (absence of artifacts associated with motion or coronary calcification); a score of 4 indicated good quality (very mild artifacts); a score of 3 indicated moderate quality (minor artifacts); score of 2 was still considered diagnostic quality (considerable artifacts but maintained visualization of arterial lumen); and a score of 1 indicated non-diagnostic quality (with severe motion artifacts or extensive wall calcification). The coronary artery tree was visually evaluated based on an SCCT 18-segment model (16) by using axial sections and curved multi-planar reformations along the vessel centreline for all segments with image quality scores of ≥1 and without severe calcification. According to the Coronary Artery Disease Reporting and Data System (CAD-RADS) (17) guidelines, luminal diameter stenosis severity was assessed in segments with a diameter of 1.5 mm or greater. The manual pipeline of post-processing and stenosis assessment is summarized in Figure 1A.
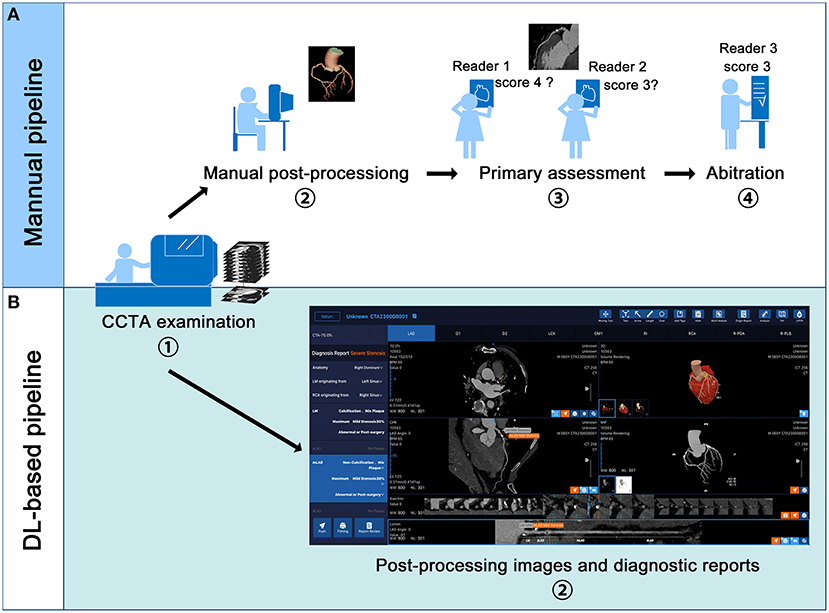
Figure 1. Manual and deep learning (DL)-based fully automated pipeline of coronary computed tomography angiography (CCTA) examination and interpretation. (A,B) displays the manual and DL-based pipeline respectively. In the DL-based pipeline, the volume rendering, curve plannar reformation, maximum intensity projection and axial images are automatically presented. The stenosis reports including the position of the lesion, the plague types and percentage of stenosis are also automatically displayed.
All CCTA findings were compared with the corresponding ICA results. The anonymized and randomly ordered ICA scans were evaluated by another 10 cardiologists with experience in judging more than 3,000 ICA scans. Following the same stenosis grading scale as CCTA, 10 independent and blinded readers were distributed evenly into 5 groups, and each group graded the coronary stenosis from ICA scans for segments with a diameter of 1.5 mm or greater. In the primary analysis, at least 50% diameter stenosis was defined as obstructive CAD for both CCTA and ICA. The secondary analysis defined a cutoff of ≥70% diameter stenosis for CCTA and ICA. And this analysis was only used to investigate the generalizability of the DL-algorithm.
If 2 readers in the same group failed to achieve a unanimous agreement for a CCTA or ICA finding, the consensus was made by either a CCTA arbitration panel consisting of 2 radiologists with experience in judging more than 8,000 CCTA scans or an ICA arbitration panel consisting of 2 cardiologists with experience in judging more than 8,000 ICA scans.
Automated Post-processing and Assessment
We used a previous-reported DL algorithm (13) to achieve automatic vascular extraction and stenosis assessment (Figures 1B, 2). The DL algorithm (CoronaryDoc, ShuKun Techonolgy, Beijing) can be divided into three parts: coronary vascular segmentation, coronary artery branches and segments identification and stenosis detection (Supplementary Figure 2). A total of 9425 retrospectively collected CCTA data from 45 hospitals in China were used for training (70%), tuning (20%) and validating (10%) the DL algorithm. Image quality evaluation and image annotation were performed in a data center, where 32 board-certified radiologists joined the work.
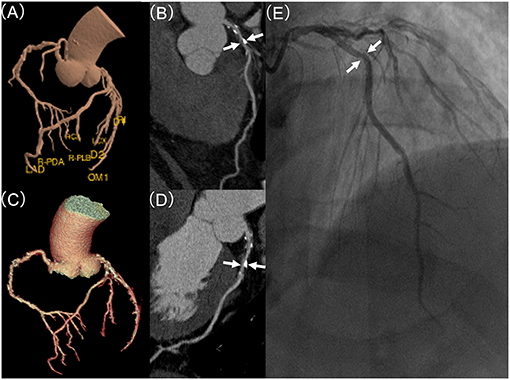
Figure 2. Coronary stenosis detection of expert readers vs. the deep learning (DL)-based fully automated algorithm, in comparison to invasive coronary artery (ICA). (A) demonstrates DL-based and (C) displays manual based volume rendering image of a coronary tree, respectively. (B,D) displays curve planner reformation image of left anterior descending (LAD) with stenosis (white arrow) based on DL or manual post-processing, respectively. (E) shows the lesion (white arrow) of LAD in invasive coronary angiography with a mild (25–49%) stenosis.
An improved 3-dimensional (3D) U-Net was used for coronary tree segmentation (18) which combined with a Bottle-Neck design for coronary arteries and aorta segmentation, and a connected growth prediction model (CGPM) for solving the problem of vascular segmentation fracture. The 3D U-net architecture was trained using the stochastic gradient descent (SGD) optimizer with a momentum of 0.95, a peak learning rate of 0.1 for randomly initialized weights, a weight decay of 0.0001, and an initial learning rate of 0.01 that shrank by 0.99995 after each training step of 200,000 iterations. Dice loss was used to evaluate the model performance (19). The model with the lowest Dice loss on the validation set was selected.
With the segmented coronary tree, the corresponding centrelines were generated using a 3D skeleton extraction algorithm (20). Reformat images including MIP, MPR, CPR and VR were automatically obtained. A fully automatic identification algorithm for coronary arteries based on SCCT 18-segment model was applied to identify the branches and segments of each coronary artery (16). In stenosis detection, V-net Fully Convolutional Neural Networks for Volumetric Medical Image Segmentation (V-net) was used (13). Atherosclerotic plaque can be classified into calcified plaque, non-calcified plaque, and mixed plaque according to its composition. Due to the different CT density of the different plagues, two 2D V-net models were trained to detect the calcified plaque on CPR and the non-calcified and mixed plaques on straightened MPR, respectively. Stenosis along the long axis of the vessel was calculated based on the radius of the plaque and the radius of upstream and downstream blood vessels.
Statistical Analysis
Statistical analysis was performed using SPSS (version 26.0, SPSS Inc., Chicago, USA) and MedCalc (version 19.0.7, MedCalc Software bvba, Ostend, Belgium). Continuous normally distributed variables are described using the mean ± SD, while not normally distributed variables are presented as median (quartiles). Categorical descriptive data are described as numbers (percentages).
To compensate for the bias caused by (a) simply regarding non-diagnostic results as either positive or negative results or (b) the exclusion of non-diagnostic data, multiple imputation was applied to impute the missing data of the non-diagnostic results in the visual assessment. The variables of sex, age, area, rows of detectors, and brand type with complete information and available visual assessment outcomes of CCTA were used in multiple imputation models. In addition, a sensitivity analysis was conducted by using the 3 × 2 table method to classify non-diagnostic results either as “false negative” or “false positive” (21) (Supplementary Figure 3).
Receiver operating characteristic analysis was used to compare the diagnostic performance of the DL algorithm and human experts, using ICA as a standard reference. For a ≥50% stenosis segment with a diameter of ≥1.5 mm, the sensitivity, specificity, positive predictive value (PPV), NPV, and AUC with 95% confidence interval (CI) were calculated by the standard methods (22). AUCs were compared using the non-parametric approach of DeLong and colleagues (23). Only vessel-based and patient-based results were evaluated because they were the most clinically meaningful.
To estimate the generalizability of the DL algorithm, AUCs were compared in sex-, age-, geographic- and scanner type-based subgroups.
Time comparison of the DL algorithm vs. manual work was performed by using Wilcoxon signed-rank test.
Results
Study Participants
Five hundred ninety-eight patients were enrolled. A total of 70 patients were excluded for the following reasons: 9 patients had a time interval ≥6 months between CCTA and ICA, 1 patient had a history of coronary artery bypass grafting (CABG), 8 patients had a history of stenting, 50 patients had incomplete or non-diagnostic ICA data, and 2 patients had coronary anomalies. In addition, 2,089 segments were missing, and 610 segments were excluded because they had diameter <1.5 mm. Therefore, 527 patients with 2,073 vessels and 6,787 segments were included in the analysis (Figure 3).
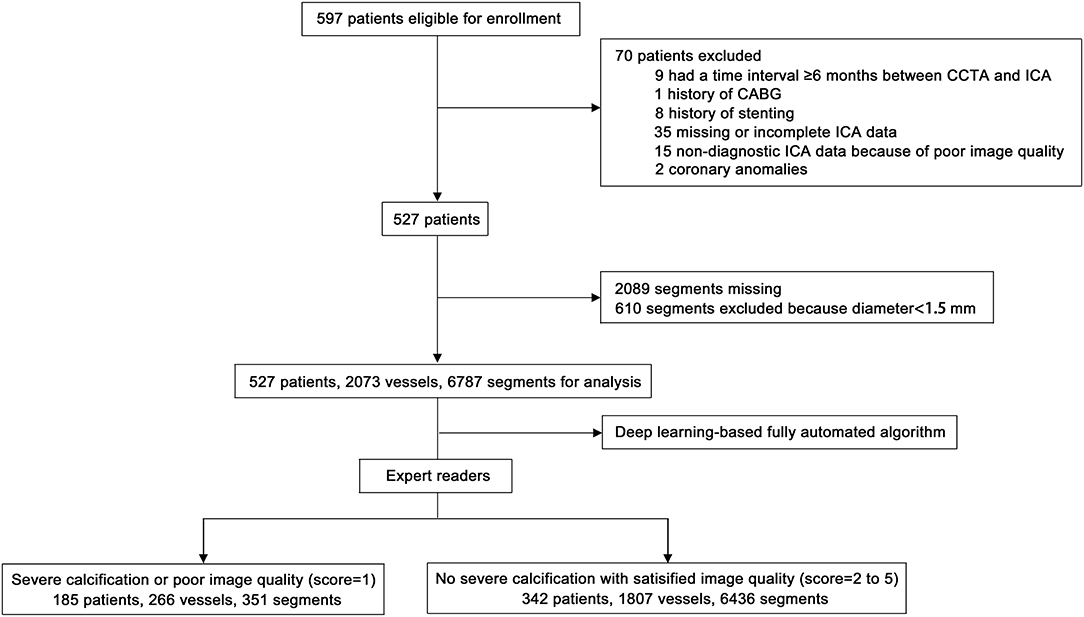
Figure 3. Flow chart of patient enrolment. CCTA, coronary computed tomography angiography; ICA, invasive coronary angiography; CABG, coronary artery bypass grafting.
Table 1 summarizes the demographic characteristics of the analysis cohort of 527 patients. Overall, in this cohort, the mean age was 62.2 ± 10.2 years, and 33.0% were females. The vessel-based prevalence of obstructive CAD was 40.3%, and the patient-based prevalence was 83.5%.
Vessel-Based Comparison of the Diagnostic Accuracy of the DL Algorithm vs. Expert Readers
The sensitivity of the DL algorithm was 65.7 (CI 62.4–68.9%), which was higher than that of the expert readers, which was 58.6 (CI 57.2–60.1%). The NPV of the DL algorithm (78.8%; CI 76.6–81.0%) was also higher than that of the experts (76.7%; CI 75.7–77.6%). However, the specificity and PPV of the DL algorithm were lower. Using the 3 × 2 table method, the additional sensitivity analysis showed that the DL algorithm performed better than the expert readers in terms of sensitivity [DL algorithm 65.7% (CI 62.4–68.9%) vs. experts 51.3% (CI 47.9–54.5%)] and NPV [DL algorithm 78.8% (CI 76.6–81.0%) vs. experts 73.0% (CI 70.7–75.3%)], while the specificity of the DL algorithm was lower. The PPVs of the DL algorithm and experts were similar (Table 2).
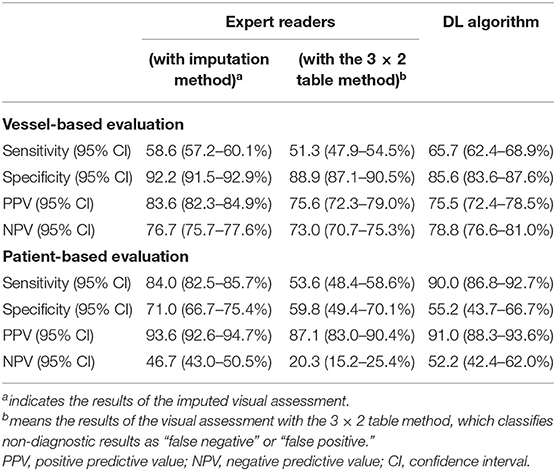
Table 2. Diagnostic accuracy of expert readers vs. deep-learning based fully automated (DL) algorithm.
The AUC of the DL algorithm was 0.83 (CI 0.82–0.84), which was significantly higher than that of the expert readers, with an AUC of 0.80 (CI 0.79–0.81) (p < 0.001). In the additional sensitivity analysis, the DL algorithm achieved an AUC of 0.76 (CI 0.74–0.78) compared with 0.70 (CI 0.68–0.72) for the expert readers (p < 0.001) (Figures 4A,B).
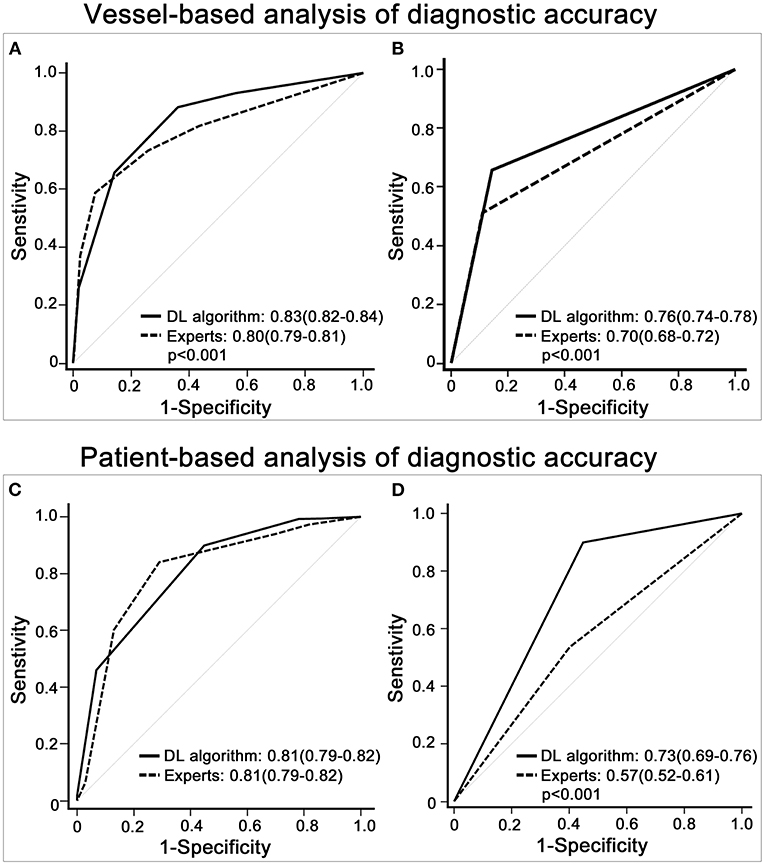
Figure 4. Diagnostic accuracy of expert readers vs. the deep learning (DL)-based fully automated algorithm. (A) shows that the receiver operating characteristic (ROC) curve of the DL algorithm was higher than that of the imputed visual assessment results in the vessel-based evaluation. (B) displays the ROC curve of the DL algorithm and that of the expert readers with the 3 × 2 table method in the vessel-based evaluation. (C,D) depicts patient-based group comparisons between the DL algorithm and expert readers, (C) shows the results of the multiple imputation data, and (D) demonstrates the outcomes of the 3 × 2 table method. The results with significant group differences are shown with p-values.
Patient-Based Comparison of the Diagnostic Accuracy of the DL Algorithm vs. Expert Readers
In the comparisons of the imputed visual evaluations, the sensitivity of the DL algorithm was higher [DL algorithm 90.0 (CI 86.8–92.7%) vs. experts 84.0 (CI 82.5–85.7%)], while the specificity and PPV of the DL algorithm were lower. The NPV of the DL algorithm was 52.2 (CI 42.4–62.0%), slightly higher than that of the experts (46.7; CI 43.0–50.5%). In the additional sensitivity analysis, the DL algorithm had higher sensitivity [DL algorithm 90.0 (CI 86.8–92.7%) vs. experts 53.6 (CI 48.4–58.6%)] and NPV [DL algorithm 52.20 (CI 42.4–62.0%) vs. experts 20.3 (CI 15.2–25.4%)] than the expert readers. Regarding specificity, the DL algorithm and experts were similar, and regarding PPV, the DL algorithm performed better (Table 2).
The AUC of the DL algorithm was 0.81 (CI 0.79–0.83), which was the same (0.81; CI 0.78–0.83) for the imputed visual evaluation. By using the 3 × 2 table method, the AUC of the DL algorithm was significantly higher [DL algorithm 0.73 (CI 0.67–0.78) vs. experts 0.57 (CI 0.51–0.62)] (p < 0.001) (Figures 4C,D).
Generalizability of the DL Algorithm
For vessel-based evaluation, the DL algorithm had similar AUCs in (a) the sex-based subgroups (male and female), (b) the age-based subgroups (<50 years, 50–69 years and ≥70 years), (c) the geographic-based subgroups (Northeast, Northwest, South, North and East China), (d) the subgroups of different detector rows (64 rows, 128 rows, 256 rows and 320 rows) and (e) the subgroups of different CT scanner brands (GE, Siemens, Philips, Toshiba and UIH) (p > 0.05) (Figures 5A–E).
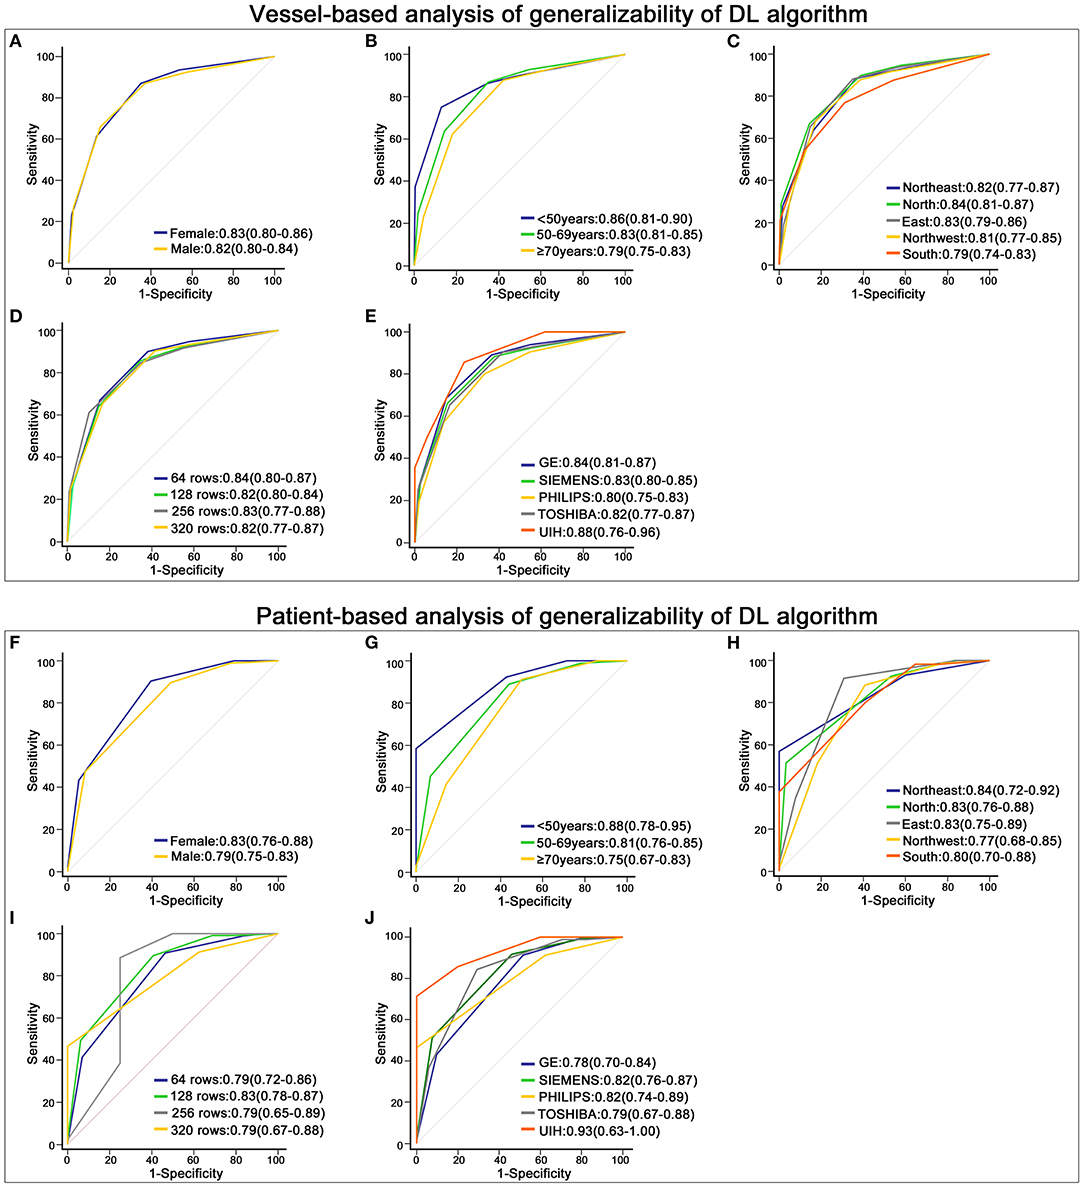
Figure 5. Robustness of the deep learning (DL)-based fully automated algorithm. (A–E) displays the receiver operating characteristic (ROC) curve of the DL algorithm in different subgroups at the vessel-based level. (A) shows the results of males and females, (B) is the outcome of patients with different ages, (C) depicts the results of patients from different geographic areas, and (D,E) display the outcomes of data acquired on different rows of detectors and different brands of CT scanners. (F–J) shows the ROC curve of the DL algorithm in groups stratified by sex (F), age (G), geographic areas (H), rows of detectors (I) and brands of CT scanners (J) at the patient-based level.
For the patient-based evaluation, the diagnostic performance of the DL algorithm remained robust in different subgroups (p > 0.05) (Figures 5F–J).
When using ≥70% stenosis a cutoff, the DL algorithm had similar AUCs in different subgroups (p > 0.05) (Supplementary Figures 3, 4).
Time Comparison of the DL Algorithm vs. Manual Post-processing
The median post-processing time by manual work was 837 [IQR:609–1,065] seconds, while DL algorithm (160 [IQR:139–192] sec) significantly reduced the post-processing time (p < 0.001).
Discussion
In this multi-center study, we used a completely external dataset to validate the diagnostic accuracy and generalizability of the DL algorithm. We found that (a) the DL algorithm performed no inferior to experts with higher sensitivity, NPV and AUC; (b) the DL algorithm performed robustly in different subgroups stratified by sex, age, geographic area, rows of detectors and brands of CT scanners; (c) the DL algorithm significantly reduced time cost.
Using ICA as a standard reference, two studies compared the diagnostic accuracy of the DL algorithm and expert readers. One reported that the DL algorithm outperformed expert readers with a vessel-based AUC of 0.87 (13), and the other showed that the DL algorithm performed equally to expert readers (14). Several limitations underlie these findings: (a) single-center designs with a small sample size, (b) CCTA data were acquired from only 1 or 2 types of CT scanners and (c) biases caused by excluding segments with poor image quality (21, 24). Several other DL-based automated algorithms have proven useful in distinguishing stenotic coronary arteries (25, 26). However, these results were obtained by using human readers' outcomes rather than ICA as standard references. Our evaluation of the diagnostic accuracy of the DL algorithm was based on a multi-center (27 sites in 5 geographic areas) and multi-vendor (4 types of detector rows and 5 brands of CT scanners) dataset. Instead of excluding segments with poor image quality or classifying non-evaluable results as either positive or negative, we used multiple imputation and the 3 × 2 table method to deal with non-diagnostic segments for visual assessment, avoiding the biased overestimation of diagnostic accuracy (21). Because the 3 × 2 table method classified non-diagnostic results as “false” results, the diagnostic accuracy based on the 3 × 2 table method was poorer than that based on multiple imputation. Compared with expert readers, the diagnostic performance of the DL algorithm was better with reliable accuracy for the diagnosis of obstructive CAD. The AUCs of the DL algorithm were 0.83 and 0.81 at the vessel and patient levels, respectively.
As has been well elucidated, the vital clinical value of CCTA, which has a non-invasive nature and high NPV, is to rule out patients without obstructive CAD. Most previous CCTA studies were performed on populations with a low (~20%) to intermediate (~50%) prevalence of disease (1, 27, 28). NPV is influenced by the prevalence of disease. Under an 82.4% prevalence of CAD, a meta-analysis found that the NPV of CCTA dropped to 42.1% (28). In our study, the 83.5% patient prevalence of CAD decreased the NPVs of both the expert readers and the DL algorithm. The NPV of the DL algorithm was 52.2%, which was still higher than that of the expert readers. Our findings indicated that the DL algorithm had a better rule-out ability than visual inspection in patients with a high prevalence of CAD.
Generalizability is a great challenge for DL-based models. If a model performs well in only a selected population, it could hardly be applied in clinical practice. To test the generalizability of the DL algorithm, we compared its diagnostic accuracy in different subgroups. When ≥50% luminal stenosis was diagnosed as CAD, the AUCs of the DL algorithm varied from 0.79 to 0.88 at the vessel level and from 0.75 to 0.93 at the patient level. Using ≥70% luminal stenosis as a cutoff, the AUCs of the DL algorithm varied from 0.82 to 0.90 at the vessel level and from 0.77 to 0.91 at the patient level. However, no significant differences were found among patients with different ages, sexes or geographic areas or among data acquired from different CT scanners. The outcome validated the robust performance of the DL algorithm and implied that the DL algorithm could work for patients in most hospitals.
Post-processing and interpreting CCTA results are time consuming and labor intensive. Fatigue from grading large numbers of images and the subjectivity of image interpretations usually result in non-negligible intra- and inter-reader variability. The large and increasing CAD populations as well as insufficient high-quality medical resources are deteriorating the supply-demand imbalance (29). Previous studies compared the post-processing and diagnostic time between the DL algorithm and humans and found that the DL algorithm displayed outstanding time efficiency (saving >80% time) (13, 14). In our study, the DL algorithm performed faster and no inferior to expert readers, and the DL algorithm remained robust in diagnosing CAD. Therefore, the DL algorithm will potentially improve the current CCTA workflow by reducing the time cost, promoting diagnostic consistency and retaining high diagnostic accuracy. The DL algorithm will benefit both patients and clinicians in several aspects. First, in the clinical scenario of a large hospital, patients who undergo CCTA will receive good services faster. For small health centers that lack professional CCTA clinicians or radiologists, the DL algorithm can supply patients with a reliable primary CCTA diagnosis. For clinicians, their accuracy and efficiency will be improved by the assistance of the DL algorithm because of the faster and more consistent detection of CAD. However, it is still worthwhile to consider how to best combine the strengths of the DL algorithm and clinicians to optimize the accuracy and efficiency of CCTA.
Our study has several limitations. Firstly, the prevalence of CAD in our study was very high, thus decreasing NPVs. A prospective study is needed to test the rule-out ability of the DL algorithm in a larger population with a lower prevalence of CAD. Secondly, luminal stenosis was visually assessed on ICA. Although visual estimation of CCTA and ICA images is most widely used in practical situation in China, using quantitative coronary angiography as standard reference may improve diagnostic performance of the DL algorithm. Thirdly, we only used the DL algorithm to diagnose anatomically significant CAD on CCTA. Since the issue of detecting functionally significant CAD (using fractional flow reserve derived from CCTA) has seen a recent explosion of interest (30–32), further studies will pay more attention to artificial intelligence in investigating hemodynamic alterations in CAD.
In conclusion, we used a completely external dataset to test the diagnostic performance of the DL algorithm. In this multi-center, multi-vendor study, we found that the DL algorithm worked faster than humans and performed no inferior to experts in terms of sensitivity, NPV and AUC. The AUCs of the DL algorithm remained satisfactory without significant group differences in patients stratified by sex, age and geographic area, as well as data stratified by CT scanner type. Our study indicated that the DL algorithm could benefit patients and clinicians due to its good accuracy, generalizability and time efficiency.
Data Availability Statement
The original contributions presented in the study are included in the article/Supplementary Material, further inquiries can be directed to the corresponding author.
Ethics Statement
The studies involving human participants were reviewed and approved by Capital Medical University Affiliated Beijing Friendship Hospital. Written informed consent was not obtained from the individual(s) for the publication of any potentially identifiable images or data included in this article.
Author Contributions
All authors listed have made a substantial, direct and intellectual contribution to the work, and approved it for publication.
Funding
This study received funding from National Key Research and Development Program of China (2019YFE0107800), Beijing Municipal Science and Technology Commission (Z201100005620009) to ZY, and National Research Foundation of Korea (2019K1A3A1A20093097) to MH. The funders had the following involvement with the study. All the funders provided financial support for patient enrollment, data collection, database construction, and management.
Conflict of Interest
NG was employed by company Shukun (Beijing) Technology Co., Ltd.
The remaining authors declare that the research was conducted in the absence of any commercial or financial relationships that could be construed as a potential conflict of interest.
Publisher's Note
All claims expressed in this article are solely those of the authors and do not necessarily represent those of their affiliated organizations, or those of the publisher, the editors and the reviewers. Any product that may be evaluated in this article, or claim that may be made by its manufacturer, is not guaranteed or endorsed by the publisher.
Acknowledgments
We acknowledged all the members in image acquisition and reading group. Members from Beijing Friendship Hospital, Capital Medical University are Jianghong Chen, Zhaohui Zhong, Dan Han, Xiaohua Wu, Qingbo Liu, Bing Hua, Fang Li, Shiyu Zhang, Jiaxin Cao, Tian Ma, Zhaozhao Wang, Rujing Sun, Xianjun Han. We also acknowledged great help from the following professors and experts: Xin Du (Beijing Anzhen Hospital, Capital Medical University), Hongjie Hu (Zhejiang University Affiliated Sir Run Run Shaw Hospital), Zhenhua Zhao (Shaoxing People's Hospital), Jin'er Shu (Jinhua Hospital of Zhejiang University), Feiyun Wu (Jiangsu Province Hospital), Bing Zhang (Nanjing Drum Tower Hospital), Xianjun Zeng (The First Affiliated Hospital of Nanchang University), Duo Zhang (Affiliated Hospital of Beihua University), Tong Zhang (The Fourth Hospital of Harbin Medical University), Jie Bian (The Second Hospital of Dalian Medical University), Junqiang Lei (The First Hospital of Lanzhou University), Junlin Zhou (The Second Hospital of Lanzhou University), Xuejun Ping (General Hospital of Ningxia Medical University), Taiping He (Affiliated Hospital of Shaanxi University Chinese Medicine), Quanxin Yang (The Second Affiliated Hospital of Xi'an Jiaotong University), Zhuozhao Zheng (Tsinghua University Affiliated Beijing Tsinghua Changgung Hospital), Huabing Li (Jincheng General Hospital), Xiaoping Yin (Affiliated Hospital of Hebei University), Xiaoqin Zhang (Inner Mongolia People's Hospital), Aishi Liu (Affiliated Hospital of Inner Mongolia Medical University), Wen Shen (Tianjin First Centre Hospital), Wenzhong Yi (The First Hospital of Huaihua City), Liling Long (The First Affiliated Hospital of Guangxi Medical University), Tao Yang (The Third Affiliated Hospital of Shenzhen University), Ruigang Huang (Zhangzhou Municipal Hospital of Fujian Province), Kunru Liang (Zhongshan Hospital Xiamen University), Dan Han (The First Affiliated Hospital of Kunming Medical University).
Supplementary Material
The Supplementary Material for this article can be found online at: https://www.frontiersin.org/articles/10.3389/fcvm.2021.707508/full#supplementary-material
References
1. Budoff MJ, Dowe D, Jollis JG, Gitter M, Sutherland J, Halamert E, et al. Diagnostic performance of 64-multidetector row coronary computed tomographic angiography for evaluation of coronary artery stenosis in individuals without known coronary artery disease: results from the prospective multicenter ACCURACY (assessment by coronary computed tomographic angiography of individuals undergoing invasive coronary angiography) trial. J Am Coll Cardiol. (2008) 52:1724–32. doi: 10.1016/j.jacc.2008.07.031
2. Liu K, Hsieh C, Zhuang N, Gao Y, Li Z, Ren X, et al. Current utilization of cardiac computed tomography in mainland China: a national survey. J Cardiovasc Comput Tomogr. (2016) 10:76–81. doi: 10.1016/j.jcct.2015.11.004
3. Jiang L, Krumholz HM Li X, Li J, Hu S. Achieving best outcomes for patients with cardiovascular disease in China by enhancing the quality of medical care and establishing a learning health-care system. Lancet. (2015) 386:1493–505. doi: 10.1016/S0140-6736(15)00343-8
4. Hu S, Gao R, Liu L, Zhu Ma, Wang W, Wang Y, et al. Summary of the 2018 Report on Cardiovascular Diseases in China. Chin Circ J. (2019) 34:209–20. doi: 10.3969/j.issn.1000-3614.2019.03.001
5. Krittanawong C, Zhang H, Wang Z, Aydar M, Kitai T. Artificial intelligence in precision cardiovascular medicine. J Am Coll Cardiol. (2017) 69:2657–64. doi: 10.1016/j.jacc.2017.03.571
6. Kolossvary M, De Cecco CN, Feuchtner G, Maurovich-Horvat P. Advanced atherosclerosis imaging by CT: radiomics, machine learning and deep learning. J Cardiovasc Comput Tomogr. (2019) 13:274–80. doi: 10.1016/j.jcct.2019.04.007
7. Motwani M, Dey D, Berman DS, Germano G, Achenbach S, Al-Mallah MH, et al. Machine learning for prediction of all-cause mortality in patients with suspected coronary artery disease: a 5-year multicentre prospective registry analysis. Eur Heart J. (2017) 38:500–7. doi: 10.1093/eurheartj/ehw188
8. Zreik M, Lessmann N, van Hamersvelt RW, Wolterink JM, Voskuil M, Viergever MA, et al. Deep learning analysis of the myocardium in coronary CT angiography for identification of patients with functionally significant coronary artery stenosis. Med Image Anal. (2018) 44:72–85. doi: 10.1016/j.media.2017.11.008
9. Hou ZH, Lu B, Li ZN, An YQ, Gao Y, Yin WH, et al. Machine learning for pretest probability of obstructive coronary stenosis in symptomatic patients. JACC Cardiovasc Imaging. (2019) 12:2584–6. doi: 10.1016/j.jcmg.2019.07.030
10. Wolterink JM, Leiner T, de Vos BD, van Hamersvelt RW, Viergever MA, Isgum I. Automatic coronary artery calcium scoring in cardiac CT angiography using paired convolutional neural networks. Med Image Anal. (2016) 34:123–36. doi: 10.1016/j.media.2016.04.004
11. Baskaran L, Maliakal G. Al'Aref SJ, Singh G, Xu Z, Michalak K, et al. Identification and quantification of cardiovascular structures from CCTA: an end-to-end, rapid, pixel-wise, deep-learning method. JACC Cardiovasc Imaging. (2019) 13:1163–71. doi: 10.1016/j.jcmg.2019.08.025
12. Wolterink JM, van Hamersvelt RW, Viergever MA, Leiner T, Isgum I. Coronary artery centerline extraction in cardiac CT angiography using a CNN-based orientation classifier. Med Image Anal. (2019) 51:46–60. doi: 10.1016/j.media.2018.10.005
13. Han D, Liu J, Sun Z, Cui Y, He Y, Yang Z. Deep learning analysis in coronary computed tomographic angiography imaging for the assessment of patients with coronary artery stenosis. Comput Methods Programs Biomed. (2020) 196:105651. doi: 10.1016/j.cmpb.2020.105651
14. Chen M, Wang X, Hao G, Cheng X, Ma C, Guo N, et al. Diagnostic performance of deep learning-based vascular extraction and stenosis detection technique for coronary artery disease. Br J Radiol. (2020) 93:20191028. doi: 10.1259/bjr.20191028
15. Abbara S, Blanke P, Maroules CD, Cheezum M, Choi AD, Han BK, et al. SCCT guidelines for the performance and acquisition of coronary computed tomographic angiography: a report of the society of cardiovascular computed tomography guidelines committee: endorsed by the North American society for cardiovascular imaging (NASCI). J Cardiovasc Comput Tomogr. (2016) 10:435–49. doi: 10.1016/j.jcct.2016.10.002
16. Leipsic J, Abbara S, Achenbach S, Cury R, Earls JP, Mancini GJ, et al. SCCT guidelines for the interpretation and reporting of coronary CT angiography: a report of the society of cardiovascular computed tomography guidelines committee. J Cardiovasc Comput Tomogr. (2014) 8:342–58. doi: 10.1016/j.jcct.2014.07.003
17. Cury RC, Abbara S, Achenbach S, Agatston A, Berman DS, Budoff MJ, et al. CAD-RADS(TM) coronary artery disease - reporting and data system. An expert consensus document of the society of cardiovascular computed tomography (SCCT), the American college of radiology (ACR) and the North American society for cardiovascular imaging (NASCI) endorsed by the American college of cardiology. J Cardiovasc Comput Tomogr. (2016) 10:269–81. doi: 10.1016/j.jcct.2016.04.005
18. Zhang CJ, Xia D, Zheng C, Wei J, Cui Y, Qu Y, et al. Automatic identification of coronary arteries in coronary computed tomographic angiography. IEEE Access. (2020) 8:65566–72. doi: 10.1109/ACCESS.2020.2985416
19. Sudre CH, Li W, Vercauteren T, Ourselin S, Cardoso MJ. Generalised dice overlap as a deep learning loss function for highly unbalanced segmentations. In: Cardoso MJ, Arbel T, Carneiro G, Syeda-Mahmood T, Tavares JM, Moradi M, et al. editors. Deep Learning in Medical Image Analysis and Multimodal Learning for Clinical Decision Support. DLMIA 2017, ML-CDS 2017 Lecture Notes in Computer Science 10553. Cham, Springer (2017). p. 240–8. doi: 10.1007/978-3-319-67558-9_28
20. Yanhui Guo AS. A novel 3D skeleton algorithm based on neutrosophic cost function. Appl Soft Comput. (2015) 36:210–7. doi: 10.1016/j.asoc.2015.07.025
21. Schuetz GM, Schlattmann P, Dewey M. Use of 3 × 2 tables with an intention to diagnose approach to assess clinical performance of diagnostic tests: meta-analytical evaluation of coronary CT angiography studies. BMJ. (2012) 345:e6717. doi: 10.1136/bmj.e6717
22. Zou KH, O'Malley AJ, Mauri L. Receiver-operating characteristic analysis for evaluating diagnostic tests and predictive models. Circulation. (2007) 115:654–7. doi: 10.1161/CIRCULATIONAHA.105.594929
23. DeLong ER, DeLong DM, Clarke-Pearson DL. Comparing the areas under two or more correlated receiver operating characteristic curves: a nonparametric approach. Biometrics. (1988) 44:837–45. doi: 10.2307/2531595
24. Andrew M, John H. The challenge of coronary calcium on coronary computed tomographic angiography (CCTA) scans: effect on interpretation and possible solutions. Int J Cardiovasc Imaging. (2015) 31 Suppl 2:145–57. doi: 10.1007/s10554-015-0773-0
25. Candemir S, White RD, Demirer M, Gupta V, Bigelow MT, Prevedello LM, et al. Automated coronary artery atherosclerosis detection and weakly supervised localization on coronary CT angiography with a deep 3-dimensional convolutional neural network. Comput Med Imaging Graph. (2020) 83:101721. doi: 10.1016/j.compmedimag.2020.101721
26. Muscogiuri G, Chiesa M, Trotta M, Gatti M, Palmisano V. Dell'Aversana S, et al. Performance of a deep learning algorithm for the evaluation of CAD-RADS classification with CCTA. Atherosclerosis. (2020) 294:25–32. doi: 10.1016/j.atherosclerosis.2019.12.001
27. Miller JM, Rochitte CE, Dewey M, Arbab-Zadeh A, Niinuma H, Gottlieb I, et al. Diagnostic performance of coronary angiography by 64-row CT. N Engl J Med. (2008) 359:2324–36. doi: 10.1056/NEJMoa0806576
28. Haase R, Schlattmann P, Gueret P, Andreini D, Pontone G, Alkadhi H, et al. Diagnosis of obstructive coronary artery disease using computed tomography angiography in patients with stable chest pain depending on clinical probability and in clinically important subgroups: meta-analysis of individual patient data. BMJ. (2019) 365:l1945. doi: 10.1136/bmj.l1945
29. Kong X, Ai B, Kong Y, Su L, Ning Y, Howard N, et al. Artificial intelligence: a key to relieve China's insufficient and unequally-distributed medical resources. Am J Transl Res. (2019) 11:2632–40.
30. Anagnostopoulos CD, Siogkas PK, Liga R, Benetos G, Maaniitty T, Sakellarios AI, et al. Characterization of functionally significant coronary artery disease by a coronary computed tomography angiography-based index: a comparison with positron emission tomography. Eur Heart J Cardiovasc Imaging. (2019) 20:897–905. doi: 10.1093/ehjci/jey199
31. Neglia D, Liga R, Caselli C, Carpeggiani C, Lorenzoni V, Sicari R, et al. Anatomical and functional coronary imaging to predict long-term outcome in patients with suspected coronary artery disease: the EVINCI-outcome study. Eur Heart J Cardiovasc Imaging. (2020) 21:1273–82. doi: 10.1093/ehjci/jez248
32. Siogkas PK, Anagnostopoulos CD, Liga R, Exarchos TP, Sakellarios AI, Rigas G, et al. Noninvasive CT-based hemodynamic assessment of coronary lesions derived from fast computational analysis: a comparison against fractional flow reserve. Eur Radiol. (2019) 29:2117–26. doi: 10.1007/s00330-018-5781-8
Keywords: coronary artery disease, computed tomographic angiography, deep learning, invasive coronary angiography (ICA), diagnostic test
Citation: Xu L, He Y, Luo N, Guo N, Hong M, Jia X, Wang Z and Yang Z (2021) Diagnostic Accuracy and Generalizability of a Deep Learning-Based Fully Automated Algorithm for Coronary Artery Stenosis Detection on CCTA: A Multi-Centre Registry Study. Front. Cardiovasc. Med. 8:707508. doi: 10.3389/fcvm.2021.707508
Received: 10 May 2021; Accepted: 14 October 2021;
Published: 05 November 2021.
Edited by:
Marcus R. Makowski, Technical University of Munich, GermanyReviewed by:
Riccardo Liga, Pisana University Hospital, ItalyMin Liu, China-Japan Friendship Hospital, China
Copyright © 2021 Xu, He, Luo, Guo, Hong, Jia, Wang and Yang. This is an open-access article distributed under the terms of the Creative Commons Attribution License (CC BY). The use, distribution or reproduction in other forums is permitted, provided the original author(s) and the copyright owner(s) are credited and that the original publication in this journal is cited, in accordance with accepted academic practice. No use, distribution or reproduction is permitted which does not comply with these terms.
*Correspondence: Zhenghan Yang, yangzhenghan@vip.163.com; Zhenchang Wang, cjr.wzhch@vip.163.com
†These authors have contributed equally to this work